Visualization on the web with open data and open source GIS
We would like to introduce data visualization by WEB GIS as an example of our research.
1. Hybrid interactive drawing method without Flash or other plug-ins.
Although a variety of data has recently been released as open data, it is difficult to intuitively grasp and analyze the time-series transition of a certain region from CSV, Excel, or other data.
In addition, visualization using maps and graphs is necessary to intuitively grasp these data, but usually GIS software or other software must be used on a desktop PC to perform the analysis. GIS software has unique concepts and terminology that take time to learn. In addition, commercial software is often expensive, making it difficult to use.
To lower the barrier and make analysis intuitive, it is necessary to use a simple user interface that can be operated by anyone on the Web, and to reduce costs by using open source software.
In the past, when displaying interactive maps or graphs without using Flash or other plug-ins in older browsers, complex rendering was very time-consuming and impractical, forcing the user to switch between displays using static images or other means.
Flash may not be available in some environments due to many serious security holes.
The method introduced in this article allows users to interactively manipulate maps and graphs even in older browsers or when plug-ins are not available, by replacing performance-intensive processing on the client (such as selecting a large number of geometries) with processing on the server.
In addition, if the browser is the latest browser compatible with HTML5, it will be possible to generate heatmaps in real time on the browser and animate them to take full advantage of the functionality.
- Open Source GIS
-
- OpenLayers(Client:JavaScript map display library)
- PostGIS(Server:GIS Add-on for PostgreSQL)
- Mapnik(Server:Map Generation Toolkit)
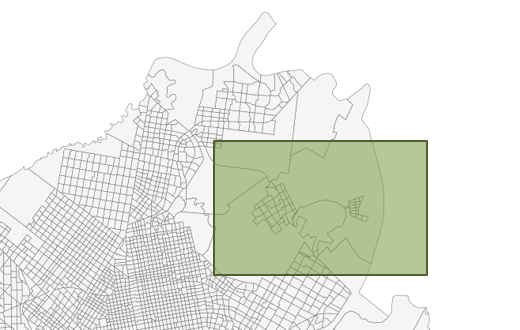
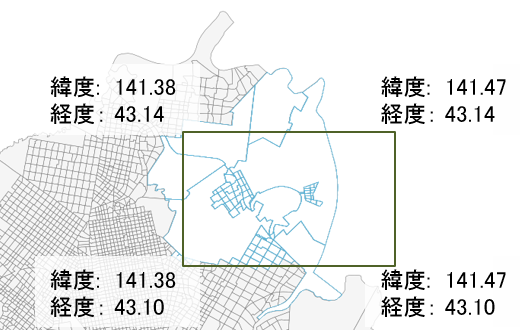
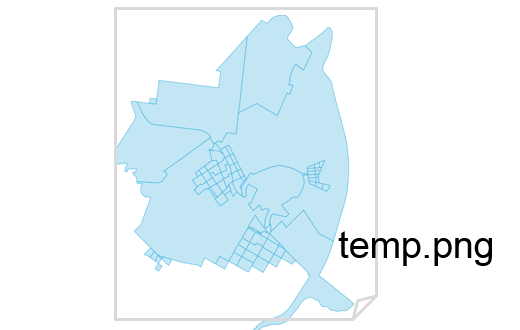
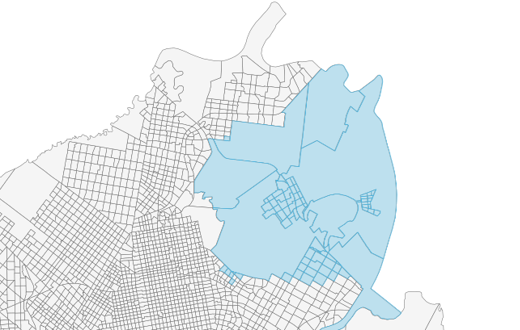
1.1. Hybrid Interactive Drawing Example (Generate selected geographic feature images on the server)
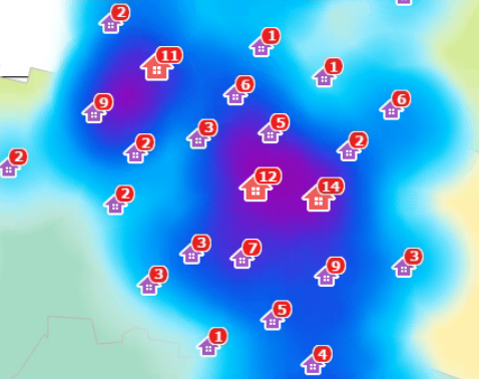
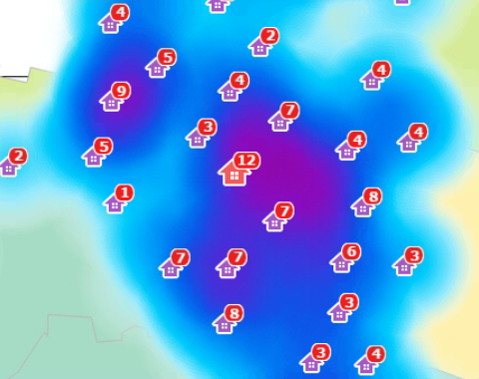
1.2. Heatmap animation in the browser(distribution density)
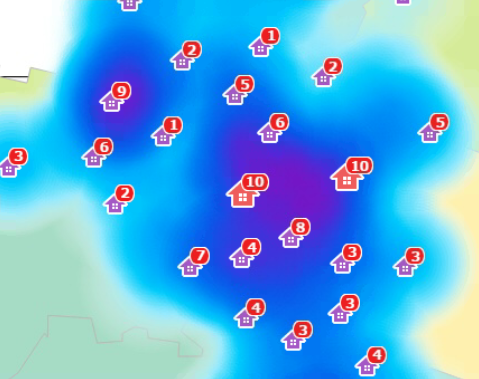 Heatmap animation in the browser(distribution density)
 Heatmap animation in the browser(distribution density)
 Heatmap animation in the browser(distribution density)
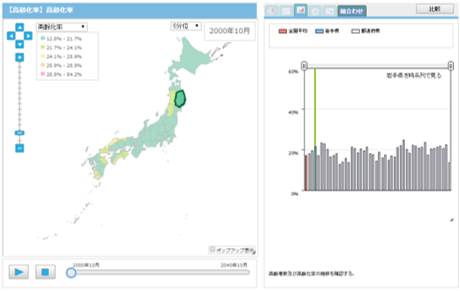
2. Display of time-series animation and time-series graphs
Time-series animations can be replayed for each geographic feature, such as administrative district boundaries, to intuitively capture value transitions.
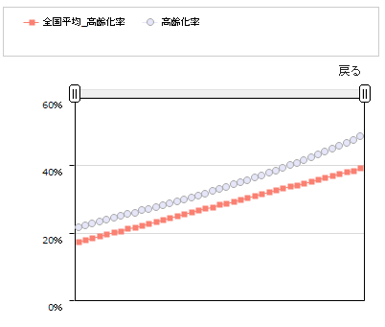
You can also select a single geographic feature to display a more detailed time series as a graph.
Aging rate
 October 2010
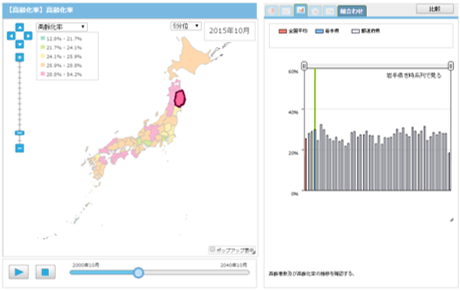 October 2015
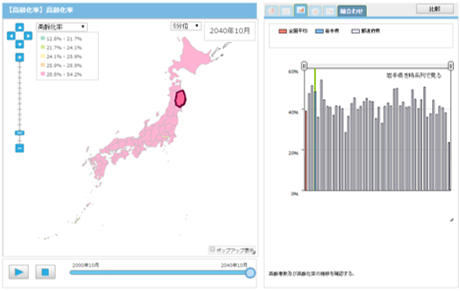 October 2040
Population aging rate in Iwate Prefecture over time
3.Proactive use of open data
Currently, when trying to obtain time-series data for each prefecture or municipality in Japan, the most comprehensive and reliable data is open data managed by the government. e-Stat's data is very convenient because it allows you to obtain data across government agencies. When estimating future data, we calculate based on various indices from the National Institute of Population and Social Security Research (NIPSSR) and estimate data up to 2040.
In addition, data from the Ministry of Land, Infrastructure, Transport and Tourism and the Geospatial Information Authority of Japan can be used to obtain administrative district boundary data and road data, which can be used for interactive area determination, reachable area and coverage analysis.
The open data specifically used in this analysis are listed below.
- Open data
-
- Map data:
Sub-regional shp data, Road shp data, Population by gender and 5-year age groups shp data, Nursing care office address latitude and longitude data - Graph data:
Data on the number of households, aging population, premiums, and estimated future population
- Map data:
4.Real-time analysis on the server
If you want to perform complex analysis, such as coverage analysis, using only the client, it is difficult to implement with older browsers. Therefore, by having GIS software on the server, such as mapnik, process requests from the web, it is possible to process them in near real-time even with older browsers.
Coverage area reached by car from nursing care offices and coverage map for persons 65 years and older
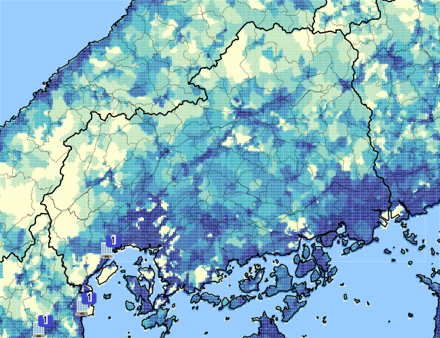
Population mesh of 65 years and older (1 k㎡)
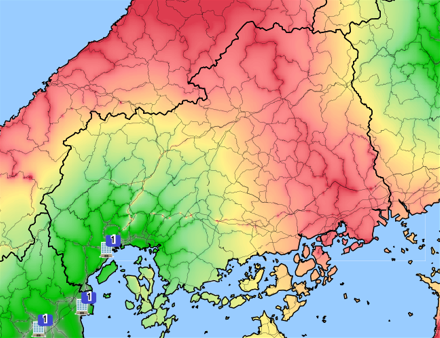
Heat map of reachable areas within 20 minutes by car from business locations
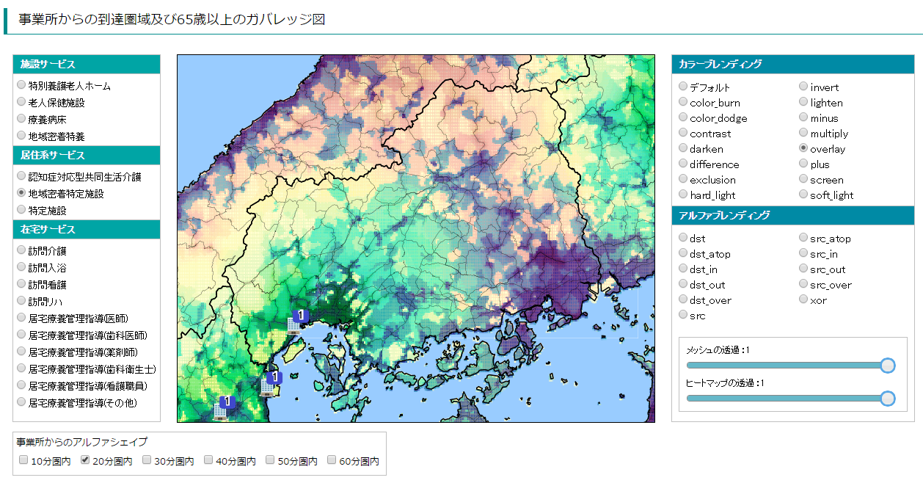
A coverage analysis can be performed by merging the elderly population mesh and the reachability area heat map in real time. The heatmap can be changed by changing the arrival time or by changing the type of establishments.
Contact
Please feel free to contact us for system development consultation, system construction quotes, and employment questions.